1) Data content: this data set is the landslide disaster data of Sanjiang Basin in the southeast of Qinghai Tibet Plateau; 2) Data source and processing method: this data set was independently interpreted by Dai Fuchu of Beijing University of technology using Google Earth; This data file is finally formed by remote sensing interpretation - on-site verification - re interpretation - re verification and other methods after 7 systematic interpretation. More than 5000 landslides have been verified on site with high accuracy; 4) This data has broad application prospects for hydropower resources development, traffic engineering construction and geological disaster evaluation in the three river basins in the southeast of Qinghai Tibet Plateau.
DAI Fuchu

The thematic map of comprehensive zoning of multi disaster susceptibility shows the spatial distribution of multi disaster susceptibility and the combination mode of disaster types in the region. It is composed of geological disaster susceptibility, earthquake disaster susceptibility, frozen soil freeze-thaw disaster susceptibility and rainstorm flood disaster susceptibility. The data is mainly generated by the calculation of remote sensing data input susceptibility evaluation model. The input data includes disaster cataloging, landform data, climate data and geological data. The data mainly includes a thematic map and the prone grid and vector data (. SHP) used for mapping. The grid size of grid data (. TIF) is 0.01 degrees, about 1200m. The data will provide reference for the development planning of the Qinghai Tibet Plateau.
TANG Chenxiao, ZHANG Guoming, LIU Lianyou

The disaster catalogue of the Qinghai Tibet Plateau contains the spatial distribution and type information of various historical disasters, ranging from Pakistan and Kashmir in the west, Qinghai Province in the East, the foothills of the Himalayas in the South and Arkin mountain in the north. The production of data is completed by a large number of manual remote sensing interpretation, field investigation, collection of geological survey data and open source data. The data is stored in the form of vector points, mainly including attribute table, indicating disaster type, coordinates and other information. This data can be used to study the spatial distribution law of disasters and disaster evaluation. This data contains a total of 23536 pieces of data. Due to the reference of geological survey data, most of the debris flow data are distributed along the road, and there are few data in no man's land.
TANG Chenxiao
")
According to the task assignment, the research group of "research and development of key technologies and equipment for monitoring and early warning of debris flow in complex mountainous areas" developed a prototype of multi index intelligent early warning and monitoring equipment for debris flow disasters such as mud water level and ground sound, and carried out demonstration application of the prototype in Guxiang gully, Tianmo gully and Peilong gully along G318 National Highway in Bomi County, Nyingchi City, Tibet in October 2019. The data submitted are the original data collected by the debris flow professional monitoring equipment deployed in Guxiang gully, Tianmo gully and Peilong gully, including the monitoring data of geoacoustic equipment, rainfall and mud water level. The monitoring data of professional equipment submitted by the Institute provides a technical guarantee for the research on the evolution characteristics of the breeding, development and formation stages of debris flow disasters in Guxiang gully, Tianmo gully and Peilong gully to a certain extent.
DONG Hanchuan , GUO Wei
")
The dataset of soil evaporation in the middle and lower Heihe River Basin at the north of Qilian Mountains (2001-2015) is stimulated by the Hydrological-Ecological Integrated watershed Flow Model (HEIFLOW). HEIFLOW is a three-dimensional distributed eco-hydrological coupling model, integrating the Precipitation-Runoff Modeling System (PRMS) with the Modular Groundwater Flow Model (MODFLOW) and several ecological modules, which can completely describe the hydrological cycle and vegetation ecological process of the basin. For the modeling details of generating this data, please refer to Han et al. (2021), and for the technical details of HEIFLOW model, please refer to Han et al. (2021), Tian et al. (2018), and sun et al. (2018)
ZHENG Yi , HAN Feng , TIAN Yong
")
The dataset of leaf area index in the middle and lower Heihe River Basin at the north of Qilian Mountains (2001-2015) is stimulated by the Hydrological-Ecological Integrated watershed Flow Model (HEIFLOW). HEIFLOW is a three-dimensional distributed eco-hydrological coupling model, integrating the Precipitation-Runoff Modeling System (PRMS) with the Modular Groundwater Flow Model (MODFLOW) and several ecological modules, which can completely describe the hydrological cycle and vegetation ecological process of the basin. For the modeling details of generating this data, please refer to Han et al. (2021), and for the technical details of HEIFLOW model, please refer to Han et al. (2021), Tian et al. (2018), and sun et al. (2018)
ZHENG Yi , HAN Feng , TIAN Yong
")
The dataset of available soil water content in the middle and lower Heihe River Basin at the north of Qilian Mountains (2001-2015) is stimulated by the Hydrological-Ecological Integrated watershed Flow Model (HEIFLOW). HEIFLOW is a three-dimensional distributed eco-hydrological coupling model, integrating the Precipitation-Runoff Modeling System (PRMS) with the Modular Groundwater Flow Model (MODFLOW) and several ecological modules, which can completely describe the hydrological cycle and vegetation ecological process of the basin. For the modeling details of generating this data, please refer to Han et al. (2021), and for the technical details of HEIFLOW model, please refer to Han et al. (2021), Tian et al. (2018), and sun et al. (2018)
ZHENG Yi , HAN Feng , TIAN Yong
")
The dataset of vegetation transpiration in the middle and lower Heihe River Basin at the north of Qilian Mountains (2001-2015) is stimulated by the Hydrological-Ecological Integrated watershed Flow Model (HEIFLOW). HEIFLOW is a three-dimensional distributed eco-hydrological coupling model, integrating the Precipitation-Runoff Modeling System (PRMS) with the Modular Groundwater Flow Model (MODFLOW) and several ecological modules, which can completely describe the hydrological cycle and vegetation ecological process of the basin. For the modeling details of generating this data, please refer to Han et al. (2021), and for the technical details of HEIFLOW model, please refer to Han et al. (2021), Tian et al. (2018), and sun et al. (2018)
ZHENG Yi , HAN Feng , TIAN Yong

Climatic warming alters the onset, duration and cessation of the vegetative season. While prior studies have shown a tight link between thermal conditions and leaf phenology, less is known about the impacts of phenological changes on tree growth. Here, we assessed the relationships between the start of the thermal growing season (TSOS) and tree growth across the extratropical Northern Hemisphere using 3451 tree-ring chronologies and daily climatic data for 1948-2014. An earlier TSOS promoted growth in regions with high ratios of precipitation to temperature but limited growth in cold dry regions. Path analyses indicated that an earlier TSOS enhanced growth primarily by alleviating thermal limitations on wood formation in boreal forests and by lengthening the period of growth in temperate and Mediterranean forests. Semi-arid and dry subalpine forests, however, did not benefit from an earlier onset of growth and a longer growing season, presumably due to associated water loss and/or more frequent early spring frosts. These broadly relevant patterns of how climatic impacts on wood phenology affect tree growth at regional to hemispheric scales, enhance our understanding of how future phenological changes may affect the carbon sequestration capacity of extra-tropical forest ecosystems.
LIANG Eryuan, GAO Shan
")
This dataset is the water balance dataset in the Yellow River source region and Qilian Mountains in the future 50 years (runoff, precipitation, evapotranspiration, soil liquid water content). It is simulated by the Geomorphology-Based Ecohydrological Model (GBEHM). The variables in the dataset include monthly runoff, monthly precipitation, monthly evapotranspiration, the monthly average 5cm soil liquid water content and the monthly average 50cm soil liquid water content. The temporal range is 2020-2070 and the spatial resolution is 1 km. The input data of the model include meteorological forcings, vegetation, soil and land use data, and the meteorological forcings are obtained from the ensemble mean of 38 CMIP6 models under SSP2-4.5 scenario. The simulation results can reflect the spatio-temporal changes of the hydrological variables in the Yellow River source region and Qilian Mountains. The dataset can be further used for researches into the eco-hydrological processes in the Yellow River source region and Qilian Mountains, and help provide a scientific basis for the optimal allocation of " mountains, rivers, forests, farmlands, lakes and grasslands " system.
WANG Taihua, YANG Dawen
")
This dataset is the water balance dataset in the Yellow River source region and Qilian Mountains in the past 40 years (runoff, precipitation, evapotranspiration, soil liquid water content). It is simulated by the Geomorphology-Based Ecohydrological Model (GBEHM). The variables in the dataset include monthly runoff, monthly precipitation, monthly evapotranspiration, the monthly average 5cm soil liquid water content and the monthly average 50cm soil liquid water content. The temporal range is 1980-2019 and the spatial resolution is 1 km. The input data of the model include meteorological forcings, vegetation, soil and land use data. The simulation results can reflect the spatio-temporal changes of the hydrological variables in the Yellow River source region and Qilian Mountains. The dataset can be further used for researches into the eco-hydrological processes in the Yellow River source region and Qilian Mountains, and help provide a scientific basis for the optimal allocation of " mountains, rivers, forests, farmlands, lakes and grasslands " system.
WANG Taihua, YANG Dawen
")
1) Data content It includes the observation year, latitude and longitude, altitude, ecosystem type and soil layer (soc0-100 (kgcm-2); 0-100 represents soil layer), underground biomass content. 2) Data sources This part of the data is obtained from the literature, specific literature sources refer to the documentation. 3) Data quality description The data cover a wide range, including comprehensive indicators, showing the content of soil organic carbon under different soil layers, with high integrity and accuracy, which can meet the estimation of soil carbon storage of grassland in Qinghai Tibet Plateau. 4) Data application achievements and Prospects It provides basic data for predicting the carbon source sink effect of soil and realizing the sustainable development of ecosystem carbon in the future.
HU Zhongmin
")
1) Data content It includes the observation year, longitude and latitude, ecosystem type, annual rainfall, drought index, annual net primary productivity, aboveground biomass, underground biomass and other data. 2) Data sources One part is from literature (1980-1995), the other part is from field sampling (2005-2006). 3) Data quality description The data has a long observation year, a large time span, a wide coverage, and many indicators, which has high integrity and accuracy, and can meet the estimation of grassland carbon storage in the Qinghai Tibet Plateau. 4) Data application achievements and Prospects It provides basic data for predicting the carbon source sink effect and realizing the sustainable development of ecosystem carbon in the future.
HU Zhongmin
 dataset of Tibetan Plateau (1980-2018)")
The data set is based on the NBP simulated by 16 dynamic global vegetation models (TRENDY v8) under S2 Scenario (CO2+Climate) and represents the net biome productivity of the ecosystem. Data was derived from Le Quéré et al. (2019). The range of source data is global, and the Qinghai Tibet plateau region is selected in this data set. Original data is interpolated into 0.5*0.5 degree by the nearest neighbor method in space, and the original monthly scale is maintained in time. The data set is the standard model output data, which is often used to evaluate the temporal and spatial patterns of gross primary productivity, and compared with other remote sensing observations, flux observations and other data.
STEPHEN Sitch
 dataset of Tibetan Plateau (1980-2018)")
The data set is based on the GPP simulated by 16 dynamic global vegetation models (TRENDY v8) under S2 Scenario (CO2+Climate) and represents the gross primary productivity of the ecosystem. Data was derived from Le Qu é r é Et al. (2019). The range of source data is global, and the Qinghai Tibet plateau region is selected in this data set. Original data is interpolated into 0.5*0.5 degree by the nearest neighbor method in space, and the original monthly scale is maintained in time. The data set is the standard model output data, which is often used to evaluate the temporal and spatial patterns of gross primary productivity, and compared with other remote sensing observations, flux observations and other data.
STEPHEN Sitch
")
This dataset includes data recorded by the Heihe integrated observatory network obtained from an observation system of Meteorological elements gradient of Daman Superstation from January 1 to December 31, 2018. The site (100.372° E, 38.856° N) was located on a cropland (maize surface) in the Daman irrigation, which is near Zhangye city, Gansu Province. The elevation is 1556 m. The installation heights and orientations of different sensors and measured quantities were as follows: air temperature and humidity profile (AV-14TH;3, 5, 10, 15, 20, 30, and 40 m, towards north), wind speed and direction profile (windsonic; 3, 5, 10, 15, 20, 30, and 40 m, towards north), air pressure (CS100; 2 m), rain gauge (TE525M; 2.5 m, 8 m in west of tower), four-component radiometer (PIR&PSP; 12 m, towards south), two infrared temperature sensors (IRTC3; 12 m, towards south, vertically downward), photosynthetically active radiation (LI190SB; 12 m, towards south, vertically upward; another four photosynthetically active radiation, PQS-1; two above the plants (12 m) and two below the plants (0.3 m), towards south, each with one vertically downward and one vertically upward), soil heat flux (HFP01SC; 3 duplicates with G1 below the vegetation; G2 and G3 between plants, -0.06 m), a TCAV averaging soil thermocouple probe (TCAV; -0.02, -0.04 m), soil temperature profile (AV-10T; 0, -0.02, -0.04, -0.1, -0.2, -0.4, -0.8, -1.2, and -1.6 m), soil moisture profile (CS616; -0.02, -0.04, -0.1, -0.2, -0.4, -0.8, -1.2, and -1.6 m). The observations included the following: air temperature and humidity (Ta_3 m, Ta_5 m, Ta_10 m, Ta_15 m, Ta_20 m, Ta_30 m, and Ta_40 m; RH_3 m, RH_5 m, RH_10 m, RH_15 m, RH_20 m, RH_30 m, and RH_40 m) (℃ and %, respectively), wind speed (Ws_3 m, Ws_5 m, Ws_10 m, Ws_15 m, Ws_20 m, Ws_30 m, and Ws_40 m) (m/s), wind direction (WD_3 m, WD_5 m, WD_10 m, WD_15 m, WD_20 m, WD_30m, and WD_40 m) (°), air pressure (press) (hpa), precipitation (rain) (mm), four-component radiation (DR, incoming shortwave radiation; UR, outgoing shortwave radiation; DLR_Cor, incoming longwave radiation; ULR_Cor, outgoing longwave radiation; Rn, net radiation) (W/m^2), infrared temperature (IRT_1 and IRT_2) (℃), photosynthetically active radiation (PAR) (μmol/ (s m-2)), average soil temperature (TCAV, ℃), soil heat flux (Gs_1, below the vegetation; Gs_2, and Gs_3, between plants) (W/m^2), soil temperature (Ts_0 cm, Ts_2 cm, Ts_4 cm, Ts_10 cm, Ts_20 cm, Ts_40 cm, Ts_80 cm, Ts_120 cm, and Ts_160 cm) (℃), soil moisture (Ms_2 cm, Ms_4 cm, Ms_10 cm, Ms_20 cm, Ms_40 cm, Ms_80 cm, Ms_120 cm, and Ms_160 cm) (%, volumetric water content), above the plants photosynthetically active radiation of upward and downward (PAR_U_up and PAR_U_down) (μmol/ (s m-2)), and below the plants photosynthetically active radiation of upward and downward (PAR_D_up and PAR_D_down) (μmol/ (s m-2)). The data processing and quality control steps were as follows: (1) The AWS data were averaged over intervals of 10 min for a total of 144 records per day.The meterological data during September 17 and November 7 and TCAV data after November 7 were wrong because the malfunction of datalogger. The missing data were denoted by -6999. (2) Data in duplicate records were rejected. (3) Unphysical data were rejected. (4) The data marked in red are problematic data. (5) The format of the date and time was unified, and the date and time were collected in the same column, for example, date and time: 2018-6-10 10:30. Moreover, suspicious data were marked in red. For more information, please refer to Liu et al. (2018) (for sites information), Liu et al. (2011) for data processing) in the Citation section.
LI Xin, CHE Tao, XU Ziwei, REN Zhiguo, TAN Junlei
")
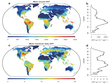
The dataset is a 30-minute eddy covariance flux observation data from nine flux stations in the Three Poles, including the data of ecosystem Net Carbon Exchange (NEE), Gross Primary Productivity(GPP), and Ecosystem Respiration (ER) . The time coverage of the data is from 2000 to 2016. The main steps of data pre-processing include outlier removal (±3σ), coordinate axis rotation(three-dimensional wind rotation), Webb-Pearman-Leuning correction, outlier elimination, carbon flux interpolation and decomposition. And missing data is interpolated by the nonlinear empirical formula between CO2 flux value(Fc) and environmental factors.
ZHANG Yangjian, NIU Ben
")
This dataset includes data recorded by the Cold and Arid Research Network of Lanzhou university obtained from an observation system of Meteorological elements gradient of Dunhuang Station from January 1 to December 31, 2018. The site (93.708° E, 40.348° N) was located on a wetland in the Dunhuang west lake, Gansu Province. The elevation is 990 m. The installation heights and orientations of different sensors and measured quantities were as follows: air temperature and humidity profile (4m and 8 m, towards north), wind speed and direction profile (windsonic; 4m and 8 m, towards north), air pressure (1 m), rain gauge (4 m), infrared temperature sensors (4 m, towards south, vertically downward), soil heat flux (-0.05 and -0.1m ), soil soil temperature/ moisture/ electrical conductivity profile (below the vegetation in the south of tower, -0.05 and -0.2 m), photosynthetically active radiation (4 m, towards south), four-component radiometer (4 m, towards south), sunshine duration sensor(4 m, towards south). The observations included the following: air temperature and humidity (Ta_4 m, Ta_8 m; RH_2 m, RH_4 m, RH_8 m) (℃ and %, respectively), wind speed (Ws_4 m, Ws_8 m) (m/s), wind direction (WD_4 m, WD_8 m) (°), air pressure (press) (hpa), precipitation (rain) (mm), four-component radiation (DR, incoming shortwave radiation; UR, outgoing shortwave radiation; DLR_Cor, incoming longwave radiation; ULR_Cor, outgoing longwave radiation; Rn, net radiation) (W/m^2), infrared temperature (IRT) (℃), photosynthetically active radiation (PAR) (μmol/ (s m-2)), soil heat flux (Gs_0.05m, Gs_0.1m) (W/m^2), soil temperature (Ts_0.05m, Ts_0.2m) (℃), soil moisture (Ms_0.05m, Ms_0.2m) (%, volumetric water content), soil conductivity (Ec_0.05m, Ec_0.2m)(μs/cm), sun time(h). The data processing and quality control steps were as follows: (1) The AWS data were averaged over intervals of 10 min for a total of 144 records per day. The data were missing during Jan. 23 to Jan. 24 because of collector failure; the data during Mar. 17 and May 24 were wrong because of the tower body tilt; The air humidity data were rejected due to program error. (2) Data in duplicate records were rejected. (3) Unphysical data were rejected. (4) The data marked in red are problematic data. (5) The format of the date and time was unified, and the date and time were collected in the same column, for example, date and time: 2018-6-10 10:30.
ZHAO Changming, ZHANG Renyi
")
The near surface atmospheric forcing and surface state dataset of the Tibetan Plateau was yielded by WRF model, time range: 2000-2010, space range: 25-40 °N, 75-105 °E, time resolution: hourly, space resolution: 10 km, grid number: 150 * 300. There are 33 variables in total, including 11 near surface atmospheric variables: temperature at 2m height on the ground, specific humidity at 2m height on the ground, surface pressure, latitudinal component of 10m wind field on the ground, longitudinal component of 10m wind field on the ground, proportion of solid precipitation, cumulative cumulus convective precipitation, cumulative grid precipitation, downward shortwave radiation flux at the surface, downward length at the surface Wave radiation flux, cumulative potential evaporation. There are 19 surface state variables: soil temperature in each layer, soil moisture in each layer, liquid water content in each layer, heat flux of snow phase change, soil bottom temperature, surface runoff, underground runoff, vegetation proportion, surface heat flux, snow water equivalent, actual snow thickness, snow density, water in the canopy, surface temperature, albedo, background albedo, lower boundary Soil temperature, upward heat flux (sensible heat flux) at the surface and upward water flux (sensible heat flux) at the surface. There are three other variables: longitude, latitude and planetary boundary layer height.
PAN Xiaoduo
Contact Support
Links
National Tibetan Plateau Data CenterFollow Us

A Big Earth Data Platform for Three Poles © 2018-2020 No.05000491 | All Rights Reserved
|  No.11010502040845
Tech Support: westdc.cn